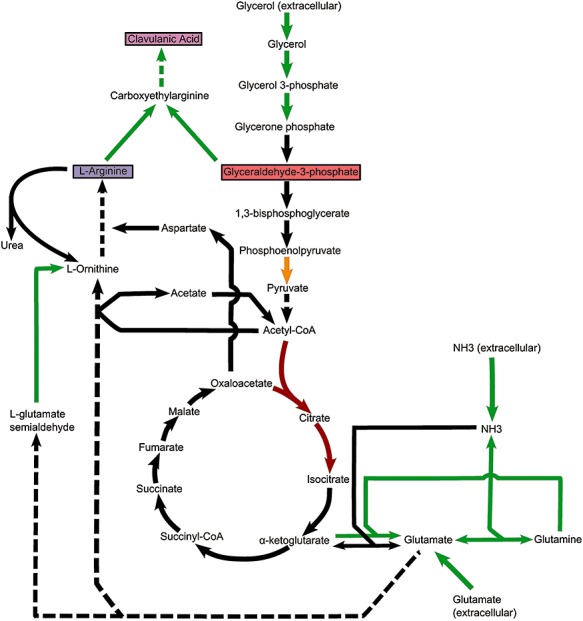
Figure 2.

Changes in S. clavuligerus primary and secondary metabolism affecting clavulanic acid production. Changes in gene expression in S. clavuligerus DS48802 compared to the wild‐type ATCC 27064 projected onto a metabolic map. Green arrows represent reactions catalyzed by genes expressed over twofold higher in DS48802 than in the wild‐type. Red arrows represent reactions catalyzed by genes expressed over twofold lower in DS48802. The orange arrow represents the reaction catalyzed by pyruvate kinase, for which two isoenzymes exist which have changed in expression differently, one being downregulated (SCLAV_4329) and the other being upregulated (SCLAV_1203). Black arrows represent unchanged steps; solid arrows represent single biosynthetic steps; and dashed arrows represent multiple steps.
