Figure 2.

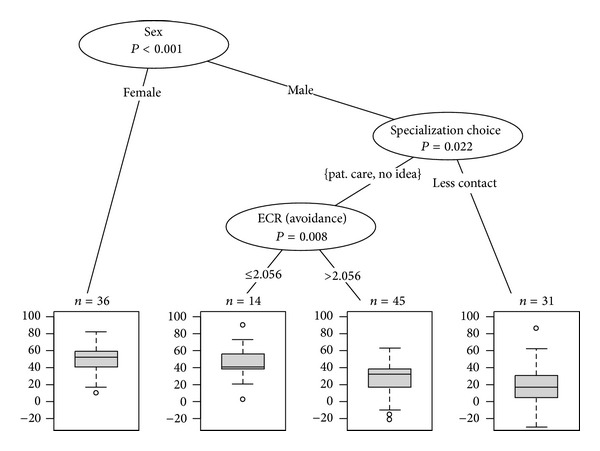
Regression tree for the BEES developed with sociodemographic data and the ECR-R subscales as input variables. The terminal nodes show the number of students for the respective subgroup, together with a boxplot of the BEES.

Regression tree for the BEES developed with sociodemographic data and the ECR-R subscales as input variables. The terminal nodes show the number of students for the respective subgroup, together with a boxplot of the BEES.