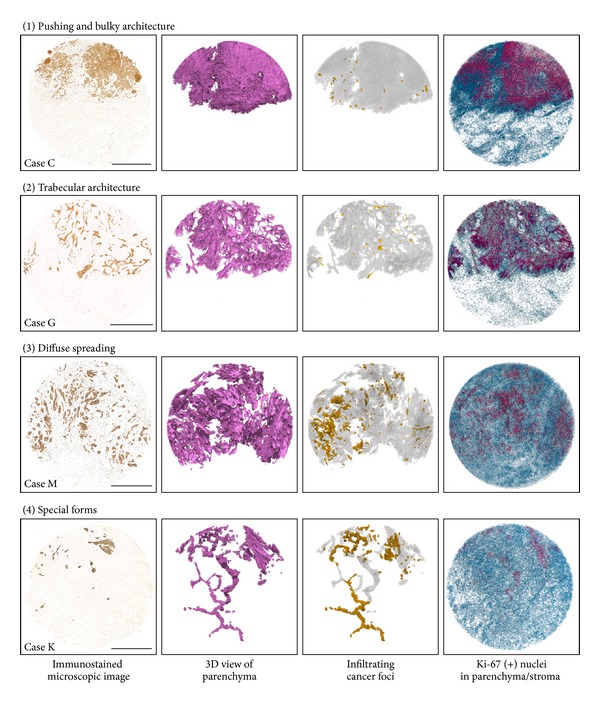
Figure 4.

Four types of tumor architecture and mitotic activity at the OTSCC invasion front. Images are from left to right: the immunostained microscopic (2D) image; 3D view of the segmented tumor parenchyma; 3D view of infiltrating cancer foci (yellow) detached in all dimensions from the bulk tumor parenchyma (gray); and Ki67-positive nuclei in the tumor parenchyma (red) and stroma (blue). Additional 3D data obtained from the remaining 10 OTSCC cases can be found in Supplementary Material Plates S2 and S3. Bar = 1 mm.
