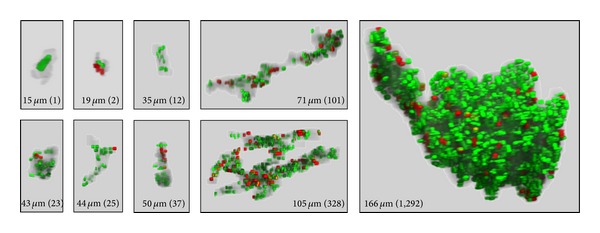
Figure 5.

Three-dimensional view of individual cancer foci segmented at the invasion front. The size of the corresponding cancer mass is expressed in terms of diameter of a sphere having the same volume. The number in parentheses indicates the number of nuclei segmented from the cancer volume. Red: Ki67-positive nuclei; green: Ki67-negative nuclei (see text for nuclear segmentation).
