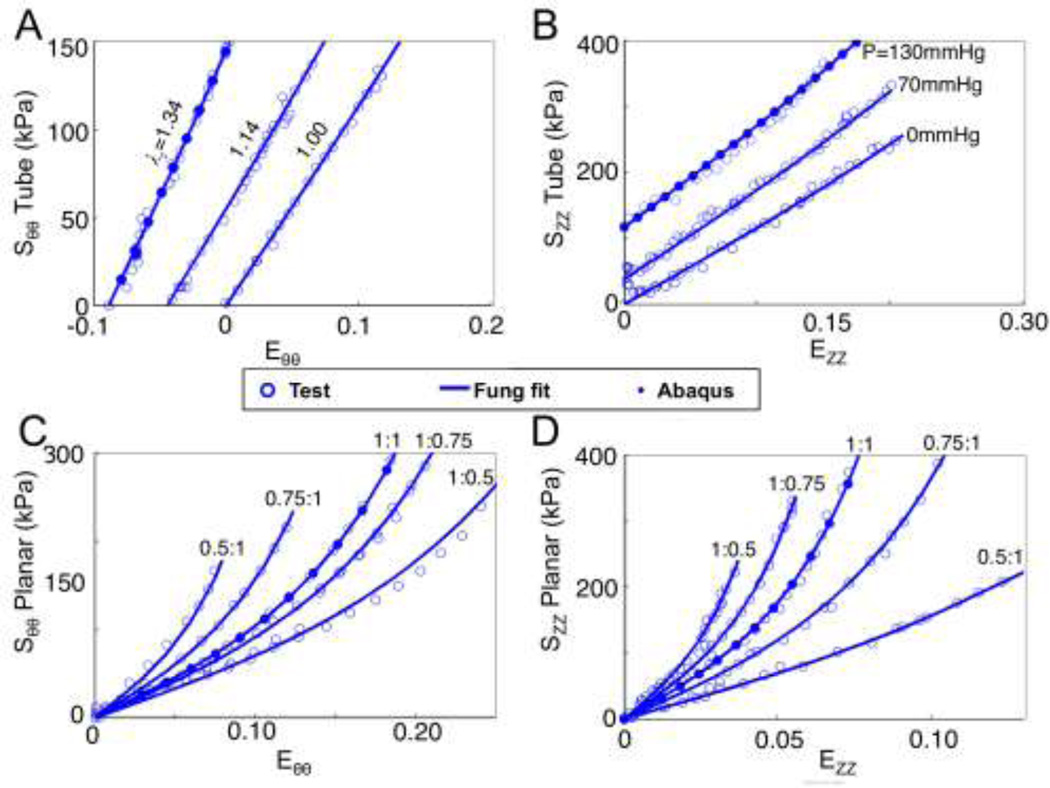
Figure 2.
Representative biaxial tensile data from the tubular (A and B) and planar (C and D) tests. The lines represent the Fung-type strain energy density fits (Eqn 2). The results from the finite element simulations from the tube stretch and inflation is shown with solid dots in panels A and B, while the results from the equibiaxial planar finite element simulation is shown with solid dots in panels C and D.

