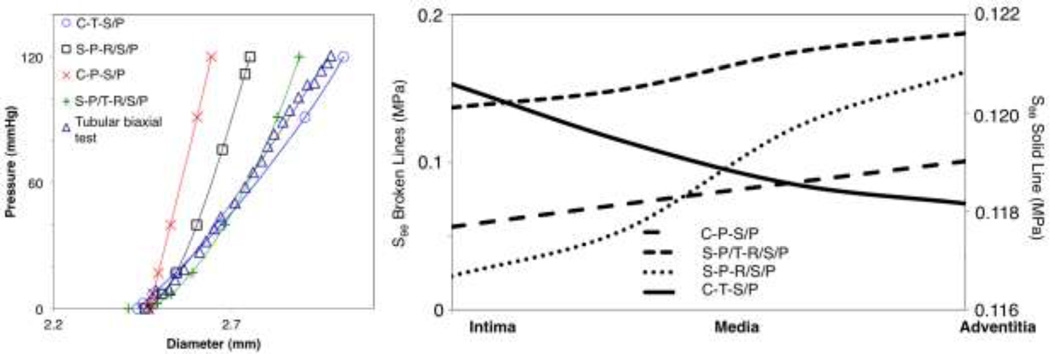
Figure 5.
Left: Pressure inflation behavior for the different finite element model simulations with a representative dataset from tubular biaxial testing, which falls closest to the average in regard to geometry. Right: Circumferential stress through the vessel wall at the end of each computational loading sequence for the different models.

