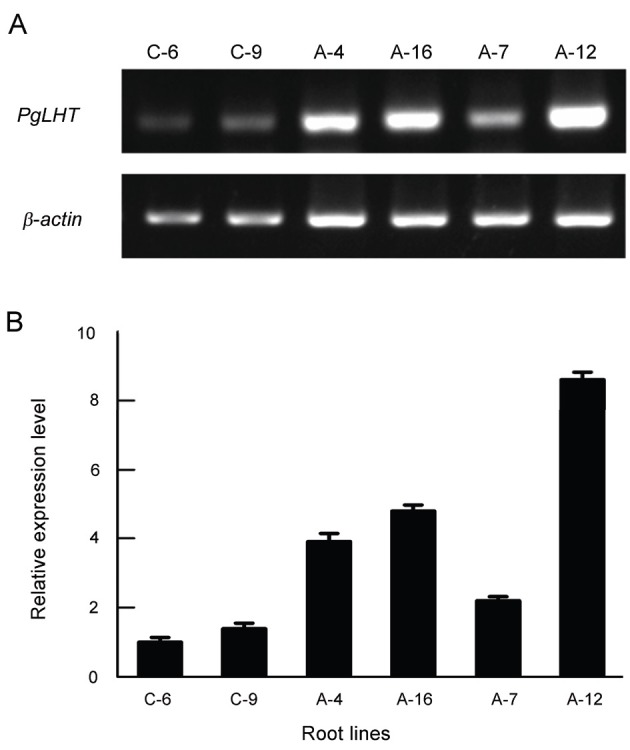
Fig. 5. Real-time (RT)- polymerase chain reaction (PCR) and real-time quantitative (qRT)-PCR analysis of PgLHT transcripts in control (empty vector; C-6 and C-9) and overexpression-PgLHT (A-4, A-7, A-12, and A-16) hairy root lines harvested at 15 day after subculture of the culture cycle. (A) RT-PCR. (B) qRT-PCR. The error bars represent the standard error of means of three independent replicates.