
Figure 5.
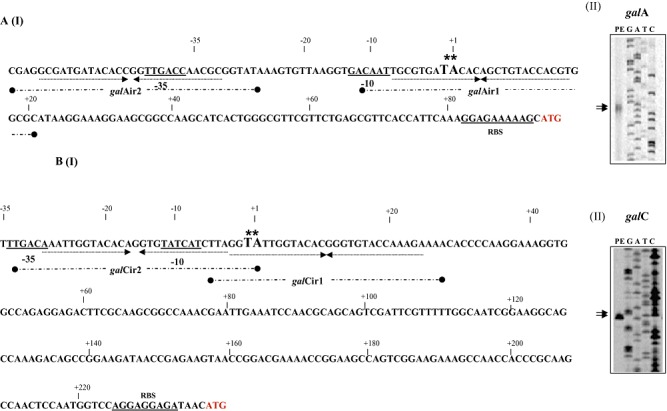
Schematic representation of the B. breve UCC2003 galA (panel A I) and galC (panel B I) promoter regions. Boldface type and underlining indicate the −10 and −35 hexamers as deduced from the primer extension results (Panel A II‐galA and B II‐galC) and ribosomal binding site (RBS); the transcriptional start sites (TSS) are indicated by asterisks; arrows under sequence in bold indicate the inverted repeat sequence that represents the GalR binding sequence. The inverted repeat sequences galAIR1 and IR2 and galCIR1 and IR2 are indicated as broken thick black line underneath the respective sequences.