
Figure 6.
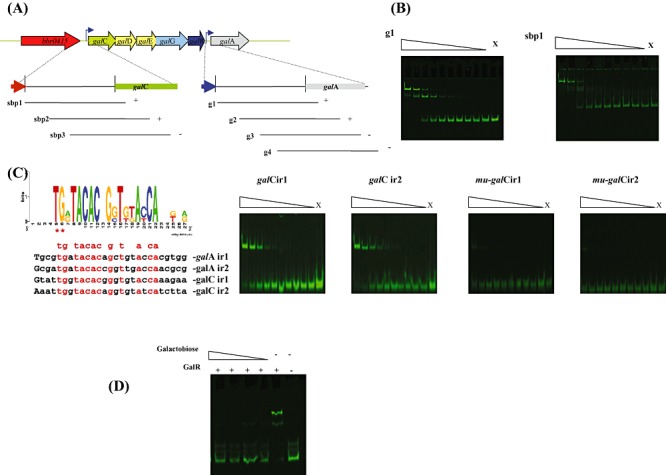
Panel A: Representation of the B. breve UCC2003 endogalactanase operon and DNA fragments used in electrophoretic mobility shift assays (EMSAs) for the galC and galA promoter resions. Plus and minus signs indicate whether or not GalR was able to bind to the particular DNA fragment respectively. Panel B: EMSA showing GalR interaction with DNA fragments encompassing fragment g1 and sbp1. Panel C: Alignment and web logo representation of predicted binding sequences of GalR together with EMSAs illustrating GalR interaction with galCIR1, galCIR2 and mutated derivatives mu‐galCIR1 and mu‐galCIR2. In each panel lane X represents a binding reaction to which no protein was added, while the remaining lanes represent binding reactions with the respective DNA probes incubated with increasing amounts of GalR (concentrations ranging from 0.04 nM 0.01 µM). Each successive lane, from right to left, corresponds to a doubling in the concentration of GalR. Panel D: EMSA showing GalR interaction with the DNA fragment g1 with the addition of galactobiose at concentrations ranging from 20–2 µM.