
Figure 3.
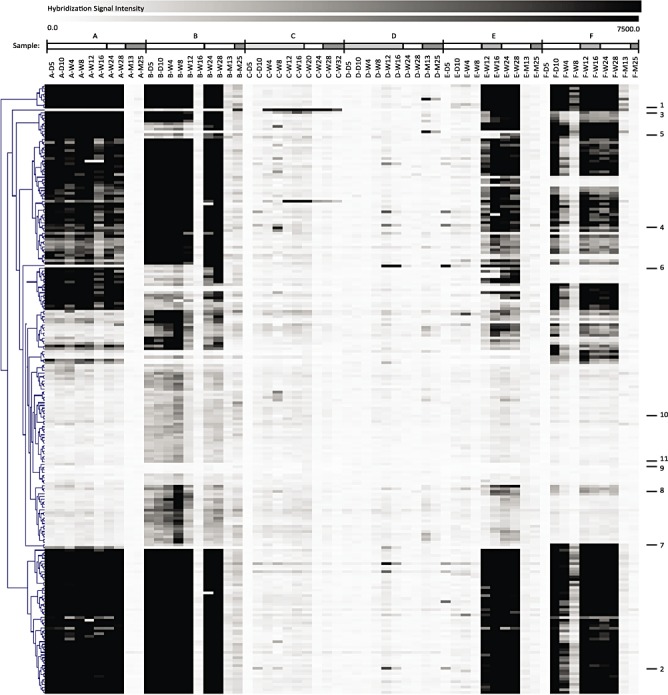
Hierarchical clustering (Pearson correlation) of the hybridization signals of genomic DNA fragments within the B. breve marker set for all faecal samples in time‐course order. Signal intensities are indicated by a black‐white colour gradient. On the X‐axis the sample codes are presented (D = day; W = week; M = month). Samples from one infant are highlighted by the bars above the codes as indicated in Fig. 1.