
Figure 1.
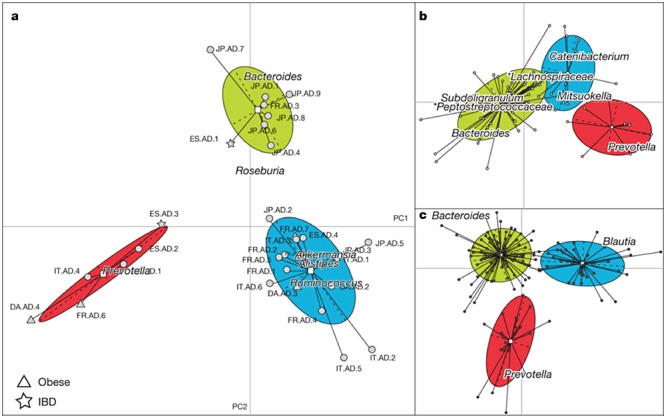
Phylogenetic differences between enterotypes. Between‐class analysis, which visualizes results from PCA and clustering, of the genus compositions of 33 Sanger metagenomes estimated by mapping the metagenome reads to 1511 reference genome sequences using an 85% similarity threshold (a), Danish subset containing 85 metagenomes from a published Illumina data set (b), and 154 pyrosequencing‐based 16S sequences (c) reveals three robust clusters that we call enterotypes. Two principal components are plotted using the ade4 package in R with each sample represented by a filled circle. The centre of gravity for each cluster is marked by a rectangle and the coloured ellipse covers 67% of the samples belonging to the cluster. IBD, inflammatory bowel disease. Adapted by permission from Macmillan Publishers: Nature (Arumugam et al., 2011), copyright 2011.