
Figure 2.
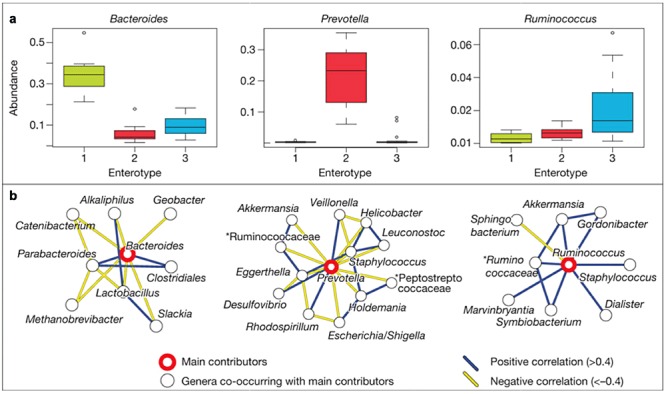
Main contributors to enterotypes. a. Phylum abundance box plots of the main contributors of each enterotype from the Sanger metagenomes as determined by read abundance. b. Co‐occurrence networks of the three enterotypes from the Sanger metagenomes. Unclassified genera under a higher rank are marked by asterisks. Adapted by permission from Macmillan Publishers: Nature (Arumugam et al., 2011), copyright 2011.