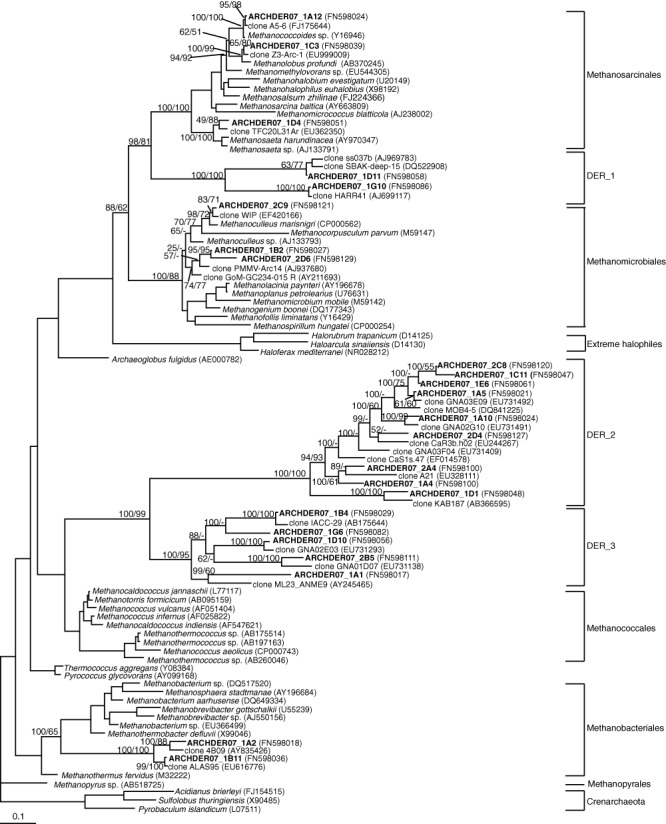
Figure 2.

Maximum‐likelihood phylogenetic tree with partial 16S rDNA archaeal sequences (695 informative positions). Clones in bold are from this study. Posterior probability values and neighbour‐joining bootstrap values (1000 replicates) are shown in the relevant nodes. The scale bar indicates 0.1 substitutions per position.
