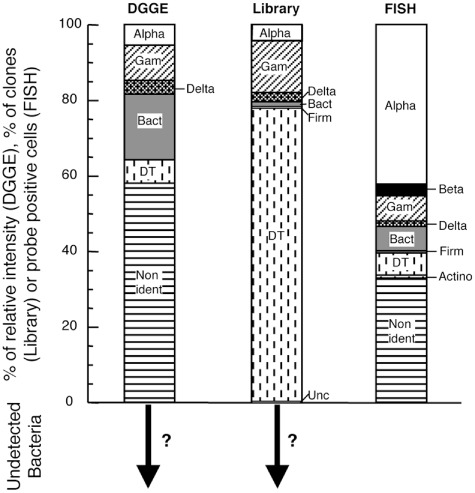
Figure 4.

Percentage of relative intensity of DGGE bands, proportions of clones (Library) and probe positive cells scaled to Eub probes (FISH) affiliated to different phylogenetic groups [Alphaproteobacteria (Alpha), Betaproteobacteria (Beta), Gammaproteobacteria (Gam), Deltaproteobacteria (Delta), Bacteroidetes (Bact), Firmicutes (Firm), Actinobacteria and Deinococcus–Thermus clone (DT)]. FISH data correspond to the mean of samples from years 2007 and 2008. The arrows with question marks indicate that an unknown proportion of phylogenetic groups cannot be retrieved by the set of primers used in both DGGE and clone libraries.
