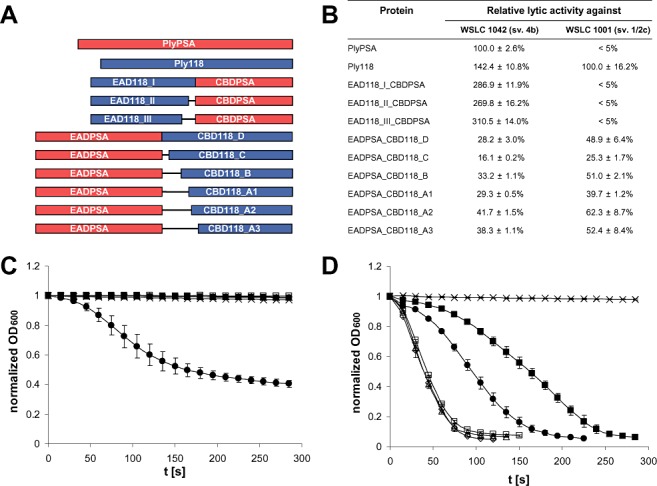
Figure 1.

Lytic activities of native endolysins and engineered fusion proteins against Listeria cells. Schematic representations of the different constructs tested here are shown in (A). The table in (B) lists relative lytic activities (mean values and standard deviations) determined from lysis curves as shown for serovar 1/2c strain WSLC 1001 (C) and serovar 4b strain WSLC 1042 (D). PlyPSA and Ply118 served as references. The changes in optical density over a period of 300 s after addition of EAD118_I_CBDPSA (□), EAD118_II_CBDPSA (◊), EAD118_III_CBDPSA (Δ), PlyPSA ( ) and Ply118 (●) to cell suspensions are shown. Buffer was added as control (x). Curves were normalized and recalculated to an initial OD at 600 nm of 1.0.
