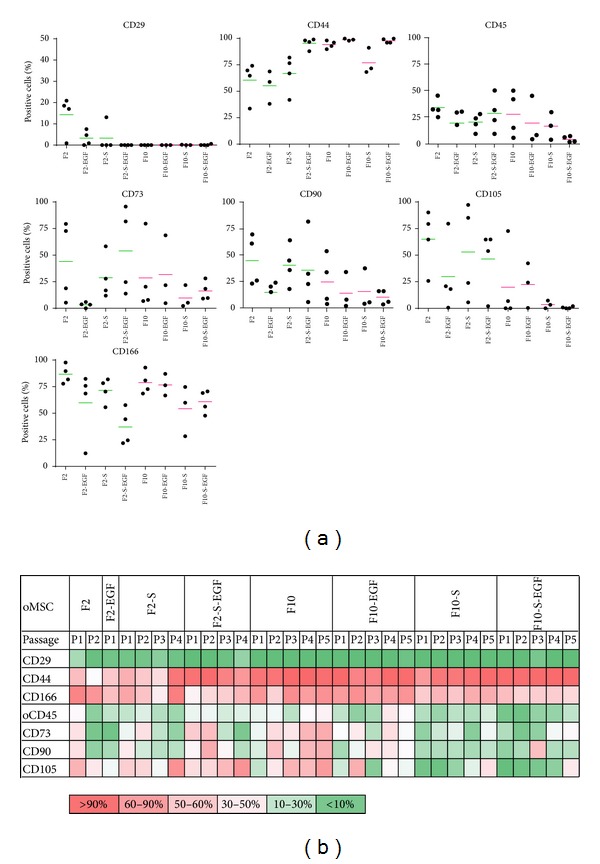
Figure 3.

Surface epitope expression analysis of oMSC, cultured in media of varying composition (FCS (F), supplements (S), and epidermal growth factor (EGF)). (a) Percentage of positive stained cells in passage 1, detected by flow cytometry. (b) Heatmap of corresponding values of positive stained cells for up to 5 passages.
