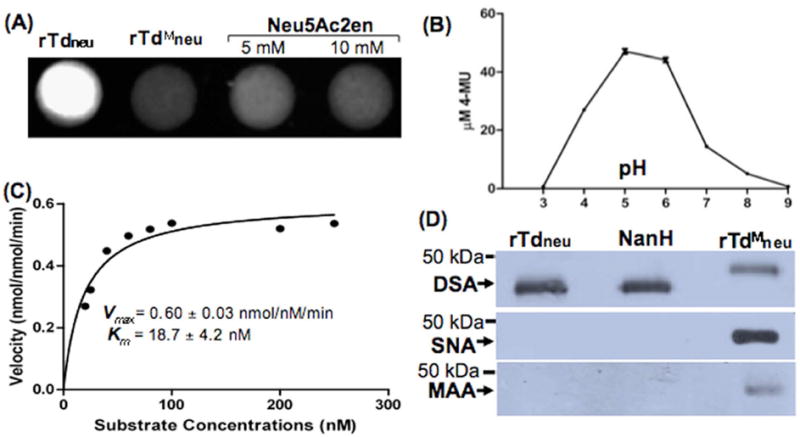
Figure 1. TDE0471 (Tdneu) enzymatic assay.

(A) Filter paper spot sialidase test of rTdneu. The substrate 4-MUNANA was treated with: rTdneu (spot 1, from the left), truncated rTdneu (rTdMneu, spot 2), and Neu5Ac2en (spots 3 and 4). The image was processed using the ChemiDoc XRS system (Bio-Rad) with an excitation wavelength of 302 nm and an emission wavelength of 548 nm. (B) rTdneu is active in a wide pH range. For this assay, the spot test was carried out from pH 3.0 to pH 9.0. The release of 4-MU (the product 4-MUNANA) was quantified based on a standard curve (fluorescence intensity vs. defined amounts of 4-MU). The data shown are the means from at least three samples. Error bars represent ± the standard error of the mean (SEM). The amounts of 4-MU (the product of 4-MUNANA) were determined using a standard curve. (C) Kinetic analysis of rTdneu. This assay was carried out according to a standard method for enzyme kinetics studies. The saturation curves were fitted to Michaelis-Menten kinetics using GraphPad Prism (GraphPad Software), and Km and Vmax were calculated. (D) Lectin blot analysis of rTdneu. The assay was performed as previously described (Gut et al., 2008;Li et al., 2012). Biotin-labeled SNA, MAA, and DSA lectins were used to detect terminal α2,6- and α2,3-linked sialic acid and galactose linked to GlcNAc of human α-1 acid glycoprotein (AGP), respectively. The C. perfringens neuraminidase NanH was used as a positive control, and rTdMneu was used as a negative control. Arrows point to the products detected by the three lectins.
