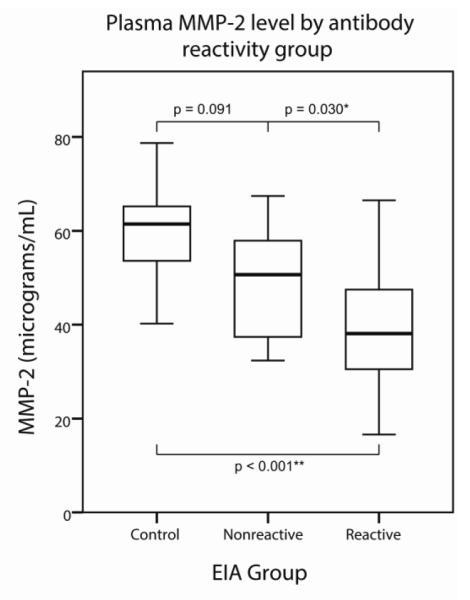
Fig. 1.

Boxes represent interquartile range (IQR). Whiskers represent data points within 1.5 IQRs of the box. A significant downward linear trend was seen for plasma MMP-2 with respect to HIV progression as grouped by antibody reactivity (p < 0.001; deviation p = 0.921). Mean MMP-2 level was reduced in the HIV antibody reactive group compared to the nonreactive group (p = 0.030). When compared to the control group, MMP-2 levels differed significantly for the antibody-reactive HIV subgroup (p < 0.001) and approached significance for the very early, nonreactive HIV subgroup (p = 0.091)
