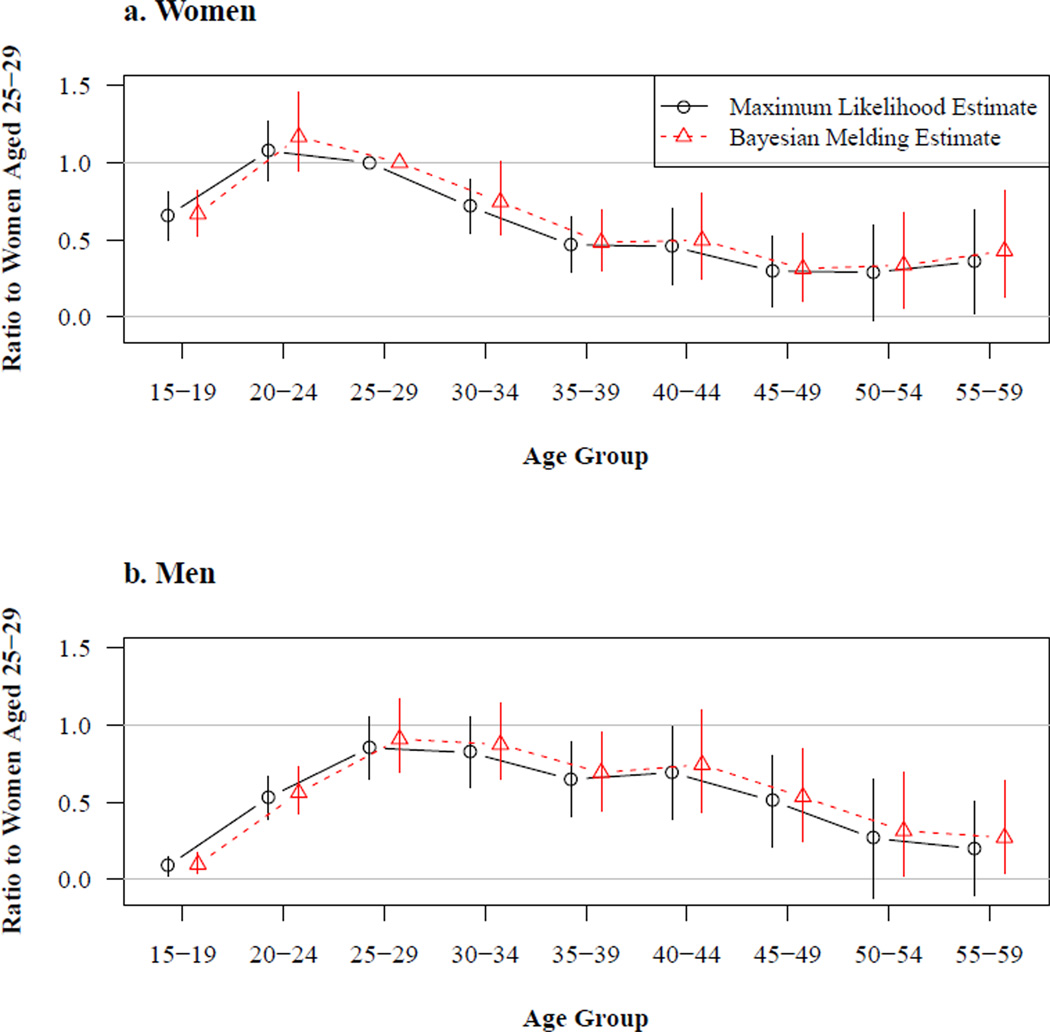
Figure 2. Estimated age schedules of HIV incidence.
Notes: These estimates are obtained using the fixed gamma curve incidence trend. The incidence of women aged 25–29 is given by the value of the incidence trend multiplied by a population-specific scale factor. All other sex-age categories in this figure are referenced to women aged 25–29 in a straightforward multiplicative sense, i.e. men aged 20–24 experience HIV incidence a little over 50% as great as women aged 25–29. Consequently this figure displays ‘relative’ HIV incidence by sex and age. The vertical lines running through the point estimates cover the 95% confidence intervals for the results and the 95% credible intervals for the Bayesian results.

