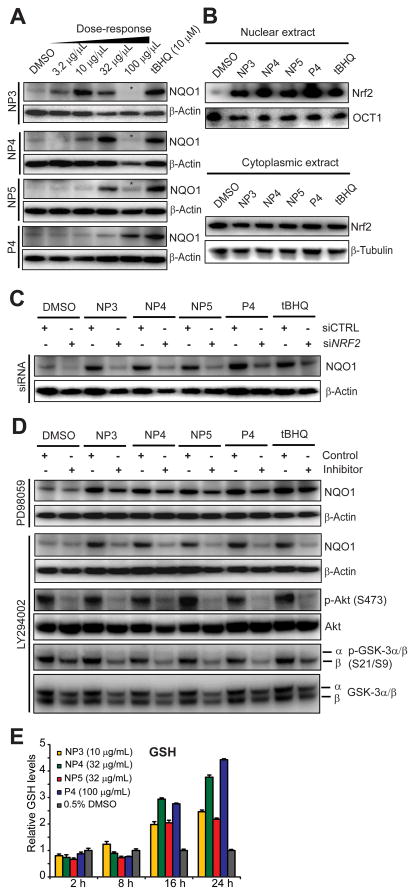
Figure 2.
Downstream responses and mechanism of ARE-controlled gene expression of active fractions in IMR-32 cells. (A) Effect on NQO1 protein levels. Cells were treated with various concentrations of NP3, NP4, NP5 and P4 for 24 h, total protein lysates prepared, resolved by SDS/PAGE and subjected to Western blot analysis. β-Actin served as loading control. Asterisks (*) indicate toxic concentrations. The most active nontoxic concentration from this analysis for each fraction was used for subsequent studies (NP3: 10 μg/mL, NP4: 32 μg/mL, NP5: 32 μg/mL, P4: 100 μg/mL). (B) Analysis of Nrf2 nuclear translocation and stabilization by Western blot analysis using previously established active fraction concentrations. Nuclear and cytoplasmic extracts were prepared with the NE-PER reagent kit (Pierce) 24 h after treatment, resolved by SDS/PAGE and the Western blots were probed with Nrf2 antibody. OCT1 and β-tubulin levels served as loading controls for nuclear and cytoplasmic extracts, respectively. (C) Cells were transfected with siRNAs targeting NRF2 or with non-targeting control siRNAs (50 nM). Upon 60 h incubation, cells were treated with the indicated fractions at active concentrations (see panel A) for another 24 h before total protein lysates were collected, separated by SDS/PAGE and subjected to Western blot analysis. (D) Effect of pharmacological kinase inhibitors on natural products-induced NQO1 protein expression. Cells were pretreated with PI3K inhibitor LY294002 (25 μM) or MEK1 inhibitor PD98059 (50 μM) for 30 min and then exposed for 24 h to active concentrations of the indicated Ulva fractions (see panel A). Total protein was collected and subjected to SDS/PAGE followed by Western blot analysis to monitor NQO1 levels and phosphorylation status of Akt and GSK-3α/β. (E) Time-dependent effects on glutathione levels. Cells were treated for the indicated times with the active concentration of Ulva fractions (see panel A), cells were harvested and analyzed for total glutathione (GSH and GSSG), which was measured using the Glutathione Assay Kit (Sigma). Results are represented as means ± SD (n = 3).

