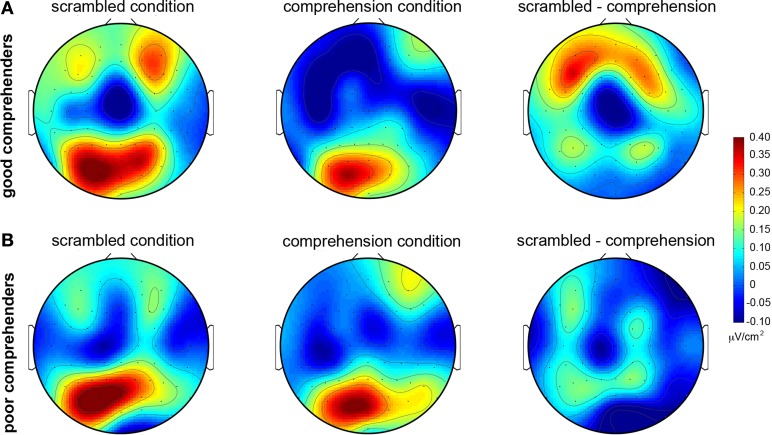
Figure 4.
Topographic maps of mean CSD-transformed ERPs during 400–500 ms post-target-word-onset in the scrambled and comprehension conditions. (A) For good comprehenders. (B) For poor comprehenders. Warm and cool colors indicate current sources and sinks, respectively (see the color bar to the right of the figure). Left column: scrambled condition. Middle column: comprehension condition. Right column: difference map (scrambled condition minus comprehension condition). The corresponding topographic maps without CSD transformation are shown in Figure A2.

