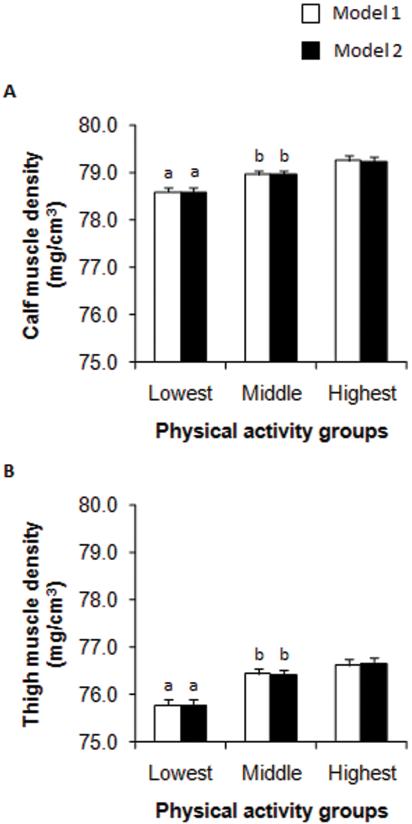
FIGURE 1.
Estimated marginal means (±SE) for calf (A) and thigh (B) muscle density (mg/cm3) for the lowest, average of the middle two, and highest fourths of physical activity in girls. Group differences were evaluated by ANCOVA. Model 1 = ethnicity, maturity offset, and muscle cross-sectional area. Model 2 = ethnicity, maturity offset, and total body lean mass. Bonferroni post hoc tests were used to adjust for multiple comparisons. a Significantly (P < 0.001) different from highest group. b Significantly (P < 0.01) different from lowest group.

