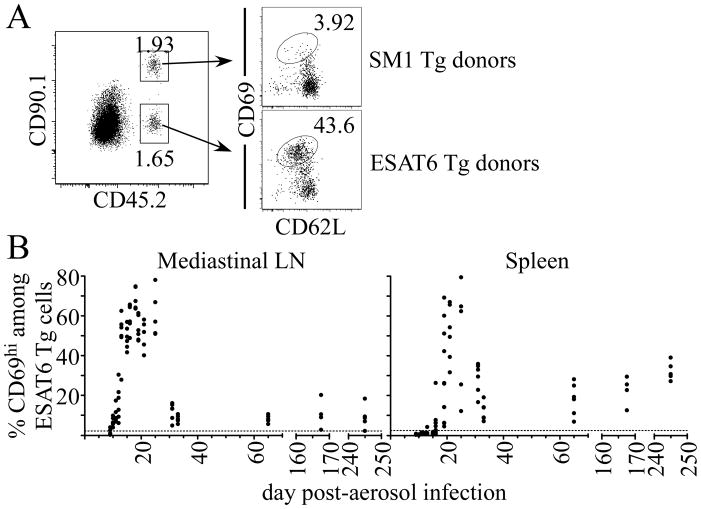
Figure 3. Naïve T cell priming during Mtb infection.
Naïve ESAT6 and SM1 transgenic T cells were isolated from mice by negative magnetic bead selection, and 1×10⁶ cells were injected, at a 1:1 ratio, into infected CD45- and Thy1-congenic recipient mice. Mice were analyzed 12 hours after cell transfer on each of the days indicated. (A) Representative flow cytometric analysis of CD69expression on ESAT6 or SM1 transgenic T cells from the spleen on day 25 post-infection. (B) Expression of CD69 on donor ESAT6 transgenic T cells in the MLN and spleen during infection. The datum represents individual mice; the dashed line indicates the mean CD69 expression of SM1 transgenic T cells in mice analyzed throughout the experiment. The data shown were accumulated from two experiments, and are representative of three independent experiments.

