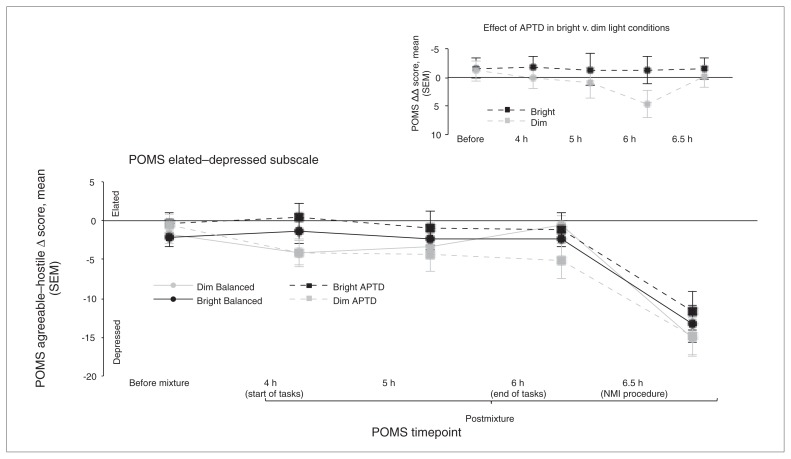
Fig. 4.
Profile of Mood States (POMS) elated–depressed mood scores by light condition (bright v. dim) comparing control balanced (BAL) and acute phenylalanine/tyrosine depletion (APTD) amino acid mixtures. Values are shown as mean Δ scores from evening baseline and standard errors of the mean (SEM). A negative change in scores represents a lowering in mood. Within the dim light group there was a trend toward increased ratings of depressed mood at 6 hours postingestion on the APTD test day compared with the BAL test day. There were no significant differences found between amino acid mixtures for the bright light condition. The inset graph depicts the same data represented as a double Δ, with difference scores calculated from morning baseline as well as net difference scores calculated between APTD and BAL at each time point within each light condition. The tendency toward a significant difference at 6 hours postingestion remained at the trend level when analyzed with the double Δ scores (p = 0.08). NMI = negative mood induction.

