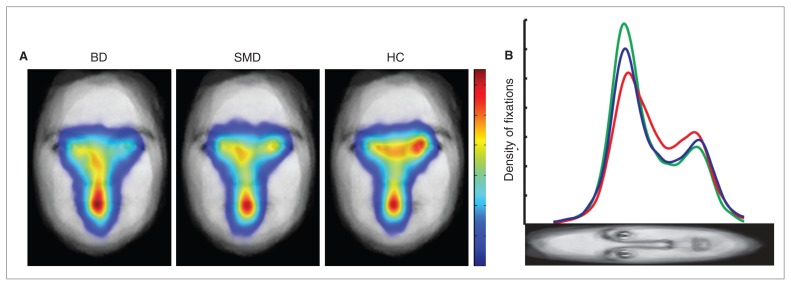
Fig. 4.
Spatial density maps and profile plot of fixations across all expressions in children with bipolar disorder (BD), those with severe mood dysregulation (SMD) and healthy controls (HC). (A) Spatial density maps. The face plotted beneath the spatial density is the average, after alignment, of all faces used in the task. Fixations are plotted as Gaussian densities summed across trials. Maps were normalized for each participant, then averaged by the number of participants in each group. All spatial density maps are scaled the same from zero fixation density (blue) to maximal fixation density (red). (B) Profile plots of fixations. Each profile plot shows horizontal summations of the spatial densities for each group. The red, blue and green lines represent the mean in the BD, SMD and control groups, respectively.

