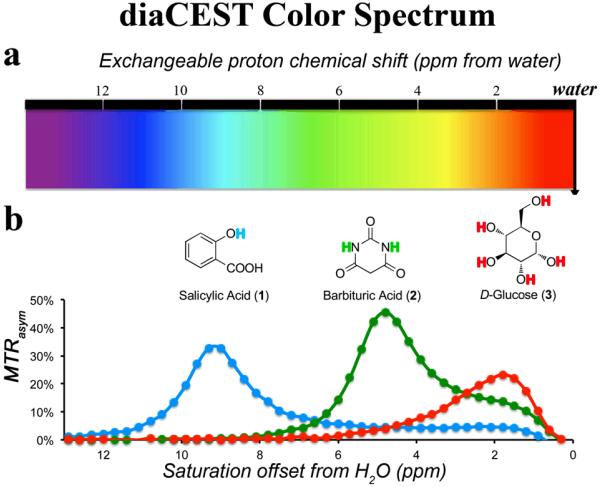
Figure 1.
Schematic depicting the color spectrum for diaCEST agents. a) range of exchangeable proton shifts observed presently for diaCEST agents; b) CEST contrast curves for three representative agents: Salicylic Acid (1), Barbituric Acid (2), and D-Glucose (3) at concentrations of 25 mM, pH 7.0,, 37°C using ω1 = 7.2 μT, tsat = 3 s for saturation.

