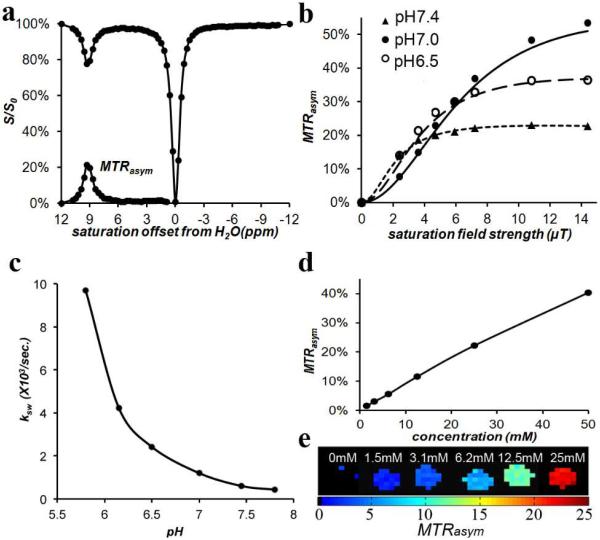
Figure 2.
CEST properties of 1 at 37°C. a) Z-spectrum and MTRasym for 25 mM at pH 7.0 using ω1 = 3.6 μT. ; b) QUESP data for 25 mM, at pH values 6.5, 7.0, 7.4; c) pH dependence of ksw based on QUESP data; d) CEST contrast at 9.3 ppm as a function of concentration, using ω1 = 7.2 μT, pH 7.0; e) CEST contrast map on phantom with assorted concentrations using ω1 = 7.2 μT, pH 7.0.

