Figure 4.
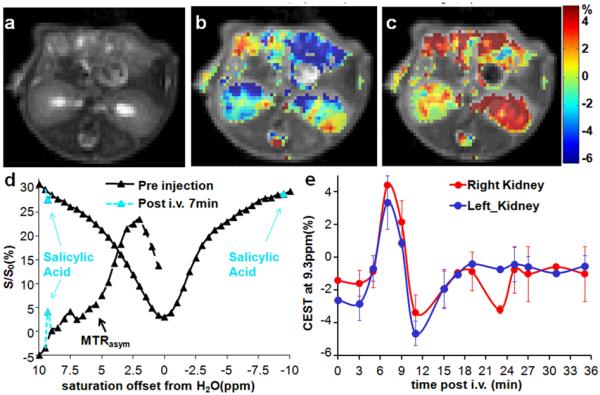
In vivo contrast for 1. a) T2w image; b) overlay MTRasym (9.3 ppm) map pre-injection; c) overlay MTRasym (9.3 ppm) map at 7 min post-injection; d) Z-spectra and MTRasym for a region of interest (ROI) enclosing the entire right kidney with pre-injection data (black), 7 min post-injection; (light blue) e) dynamic time course of the MTRasym (9.3 ppm) for ROIs enclosing the whole left kidney and right kidney. ω1 = 7.2 μT (n = 2).

