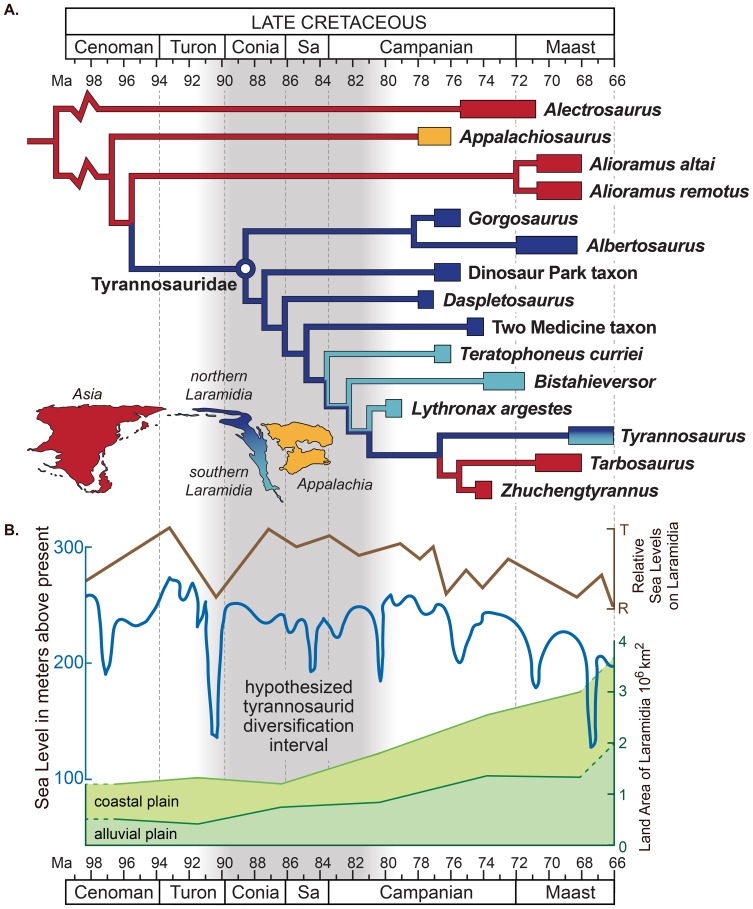
Figure 4. Sea level change and the hypothesized evolutionary diversification of Tyrannosauroidea.
Sea level indicators include: (A) Time-calibrated phylogenetic relationships and paleobiogeographic distribution of tyrannosaurids with biogeographic origin indicated by color (see Methods and File S1 for details of analyses and the stratigraphic and phylogenetic relationships of tyrannosauroids within theropod dinosaurs). (B) Late Cretaceous regional transgression-regression cycles on Laramidia (brown [31]); global sea-level fluctuations (blue [34], [35]); and areal extent of Laramidia at minimum (alluvial plain) and maximum (alluvial plain and coastal plain) sea levels (green [1]).

