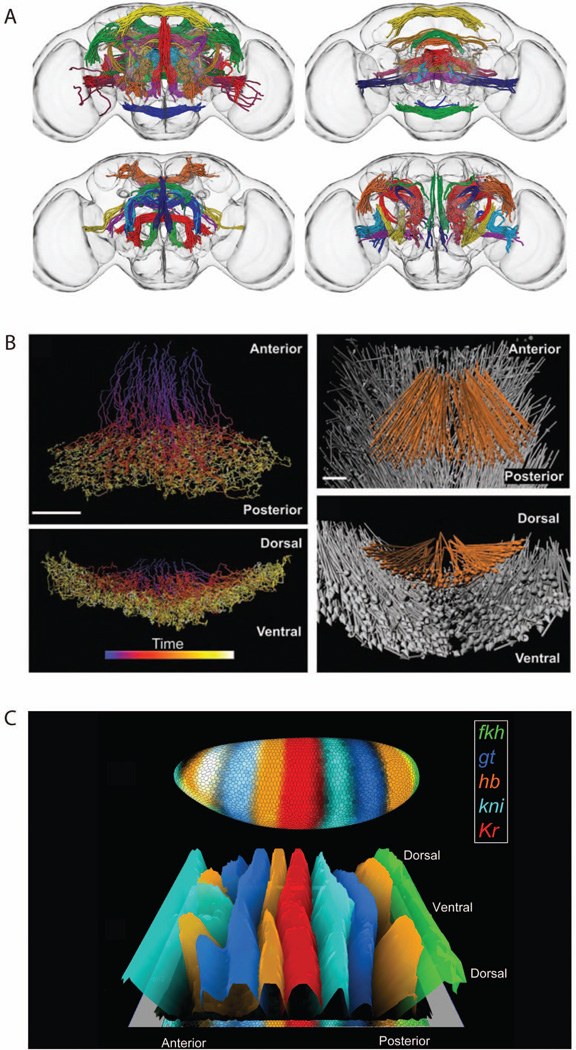
Figure 1. Examples of three dimensional atlases.
A. The FlyCircuit atlas of neuronal connectivity in Drosophila brains8. Each color groups members of a neuronal tract. Each panel displays different subsets of tracts. B. Cell migration during gastrulation in Drosophila embryos3. The two left panels show cell movements over time. The two right panels show the net displacement vectors, with mesoderm cells shown in orange and ectoderm cells show in grey. C. Patterns of mRNA expression of transcription factors in Drosophila blastoderm embryos10. The upper view shows a three dimensional representation of the embryo. The lower view shows a cylindrical projection in which height indicates the level of expression of each transcription factor in each cell. Both views were generated using the visualization tool PointCloudXplore75, 78

