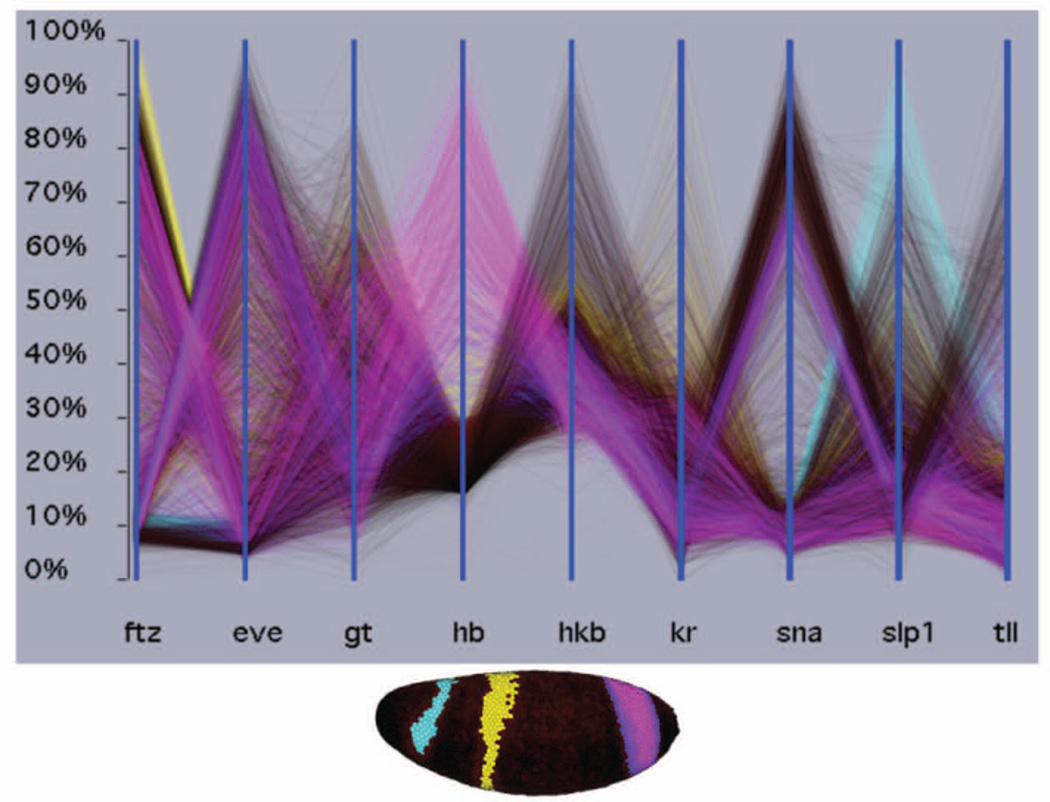
Figure 4. Visualizing 3D gene expression by parallel coordinates.
Each vertical axis shows the mRNA expression levels for one gene in each of the 6,000 cells in the Drosophila blastoderm embryo. The lines connect data for the same cells. Blue lines connect cells expressing the anterior most stripe of hunchback (hb), yellow lines the central hb stripe and pink lines the posterior stripe. The locations of these cells are shown in the physical 3D view below. In the parallel coordinates, it can be readily seen that the anterior stripe on hb coincides with high slp1 expression, the central hb stripe with high ftz expression, and 50% of the posterior hb stripe with high eve expression. These views were generated using PointCloudXplore, an interactive visualization tool (http://bdtnp.lbl.gov/Fly-Net/bioimaging.jsp?w=pcx)75.

