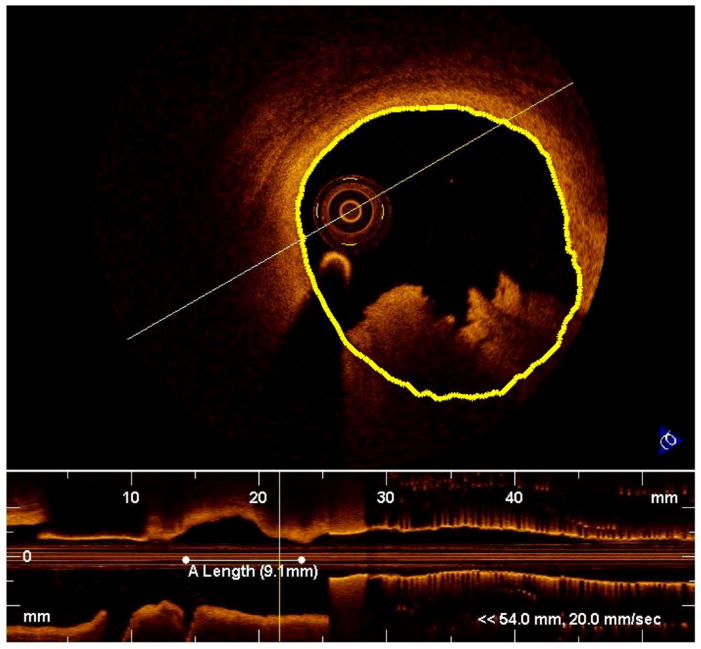
Figure 2. Optical coherence tomography identification of plaque erosion.
Intravascular OCT reveals the cross-sectional anatomy of a coronary artery (top) and a longitudinal view of the vessel (bottom). Thrombus appears at the bottom of the cross-section as positive signal with jagged edges. We approximated the vessel boundary (yellow line) although underneath the thrombus, exact segmentation is impossible. In the longitudinal view, extent of the thrombus is marked with a horizontal white line.

