
Figure 4.
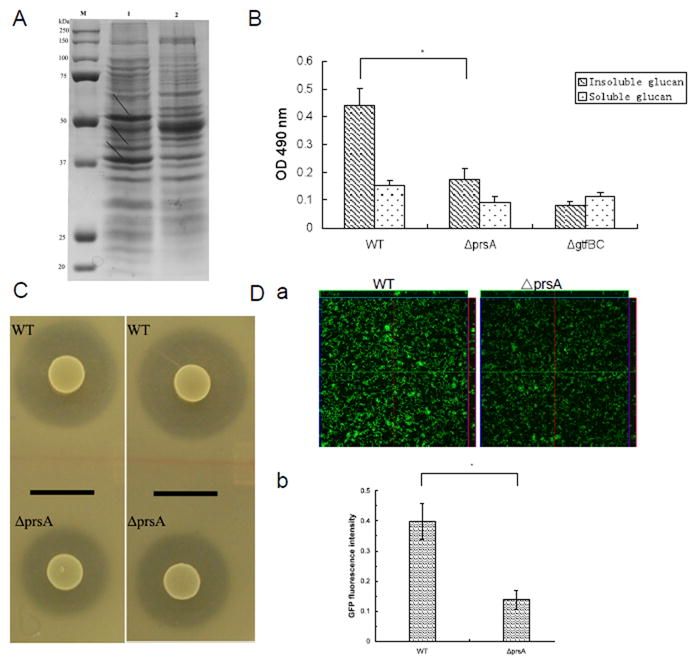
Analysis of PrsA-dependent phenotypes. (A) SDS-PAGE (10%) analysis of cell cell wall/ membrane proteins from S. mutans UA140 and the prsA-deficient strain. Lanes: M, prestained protein markers (Bio-rad); 1, S. mutans UA140; 2, UA140 prsA-deficient strain. Arrows indicate differentially expressed cell wall/ membrane proteins. (B) Glucan production of S. mutans UA140 wild type and the prsA-deficient strains in TH medium supplemented with 100 mM sucrose. S. mutans UA140 gtfBC-deficient strain was used as a negative control. Each data point is the average of triplicate samples, and the error bars indicate standard deviations. The asterisk indicates that prsA-deficient strain produced significantly less insoluble glucan than wild type (Student’s t test p value <0.05). (C) Drop inoculum deferred antagonism assay for S. mutans UA140 wild type and the prsA-deficient strains. The clear zone indicates mutacin IV production. The indicator strains are S. sanguinis (left panel) and S. gordonii (right panel) respectively. (D) GFP fluorescent signals of 3-h biofilms of S. mutans wild-type and the prsA-deficient, both carrying surface-displayed GFP-SpaP fusion protein. (a) CLSM analysis of surface-expressed GFP fluorescent signals within biofilms. (b) Quantification of GFP fluorescent signals within biofilms. The fluorescence intensities of S. mutans wild-type and the prsA-deficient biofilms were normalized to the number (CFU counts) of bacteria present in the well. The GFP expression percentage was calculated as the amount of fluorescence signal of prsA-deficient strain of vs its parent strain.