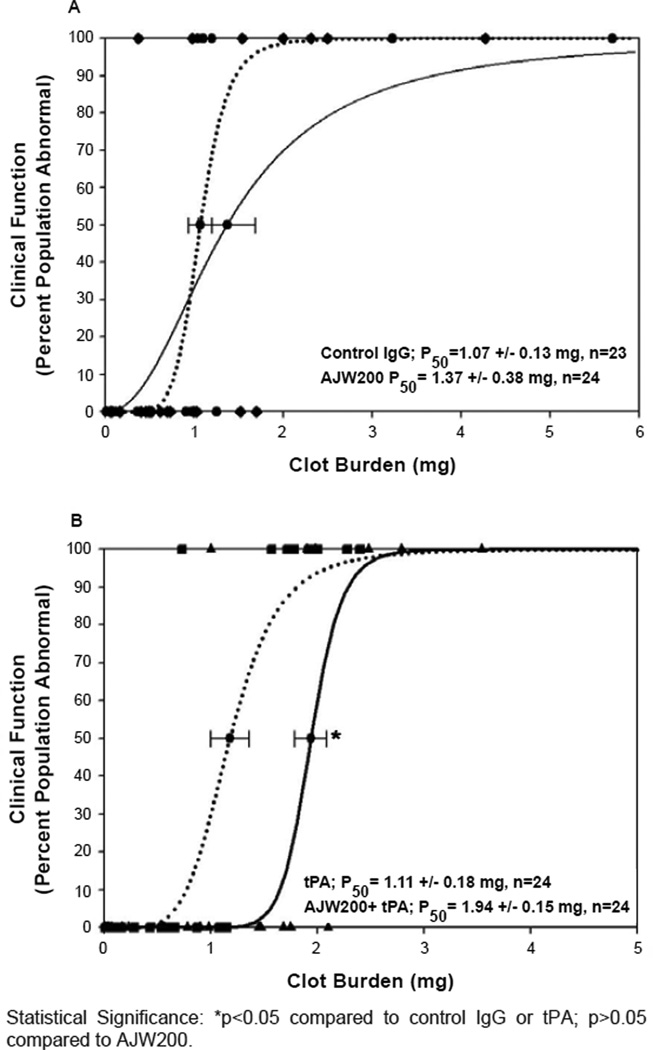
Figure 1. Quantal curves: anti-vwf-ab/tpa combination analysis.
A: Effect of AJW200 alone or in combination with low-dose tPA on clinical function. Control IgG (0.3mg/kg); Black Circles- Black Dotted LINE; AJW200 Ab (0.3 mg/kg) Black DIAMONDS- Black Solid LINE. B: Effect of AJW200 in combination with low-dose tPA on clinical function compared to low dose tPA. tPA (0.9mg/kg)- Black Squares- Black Dotted LINE; AJW200 (0.3mg/kg) + tPA (0.90 mg/kg IV- Black Triangles UP- Black Solid LINE.
Statistical Significance: *p<0.05 compared to control IgG or tPA; p>0.05 compared to AJW200.

