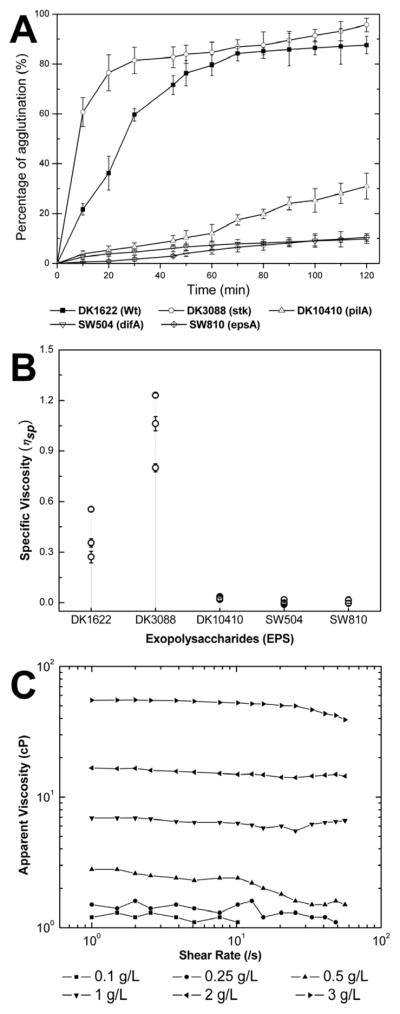
Fig. 2.

Agglutination of M. xanthus cells and rheological properties of EPS. Panel A: agglutination of mutants in broth. Cells were grown overnight in CYE medium and the OD600nm was adjusted to about 1.0. The assay was conducted as described in Materials and Methods. The data represent triplicate experiments, and mean ± SD is plotted. Panel B: specific viscosity (ηsp) of EPS suspensions isolated from 5×10¹⁰ cells of different strains. For each strain, three parallel EPS samples were prepared and each sample was tested for three times, and mean ± SD were plotted. Panel C: influence of shear rate and concentration on the rheological curves of WT-EPS suspensions.
