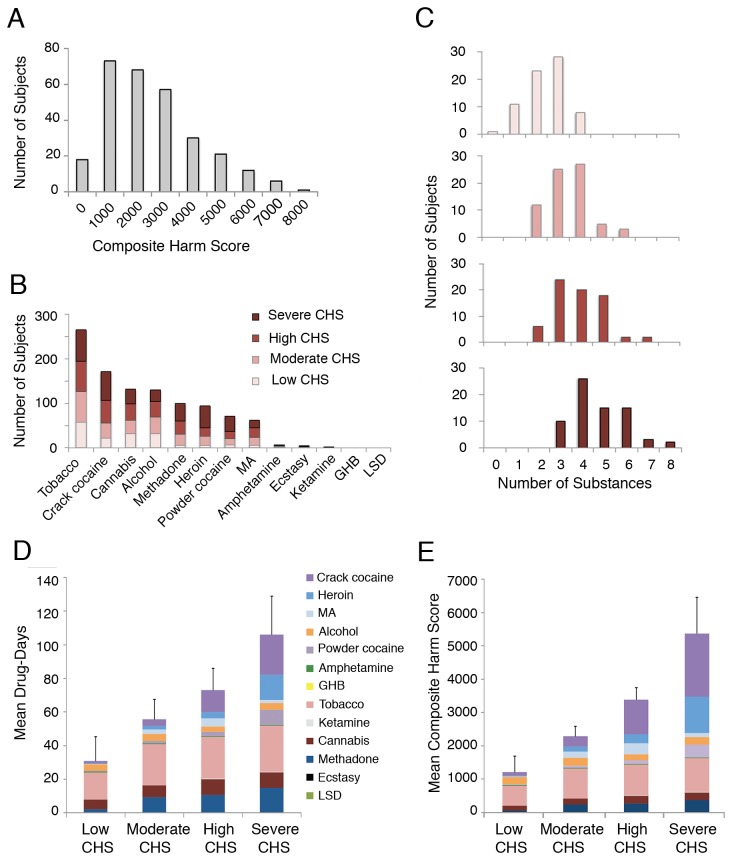
Figure 1. Composite harm scores.
Panel A shows the distribution of Composite Harm Scores of the cohort from the first month of study. Panel B shows the prevalence of types of substance use during the first month of study across CHS quartile groups. MA: methamphetamine. Panel C shows the number of subjects in CHS quartile groups using multiple substances during the first month of study. Panel D shows the mean sum of the number of days using each substance during the first four weeks of the study for CHS quartile groups. Colors represent individual drugs, ordered from top to bottom in decreasing ISCD harm to user scores. Error bars indicate SD. Panel E shows the mean CHS for each CHS quartile group, colors indicating the contribution of harm from each substance (ISCD drug harm score * frequency) to the mean CHS value for the quartile group. Error bars indicate SD.

