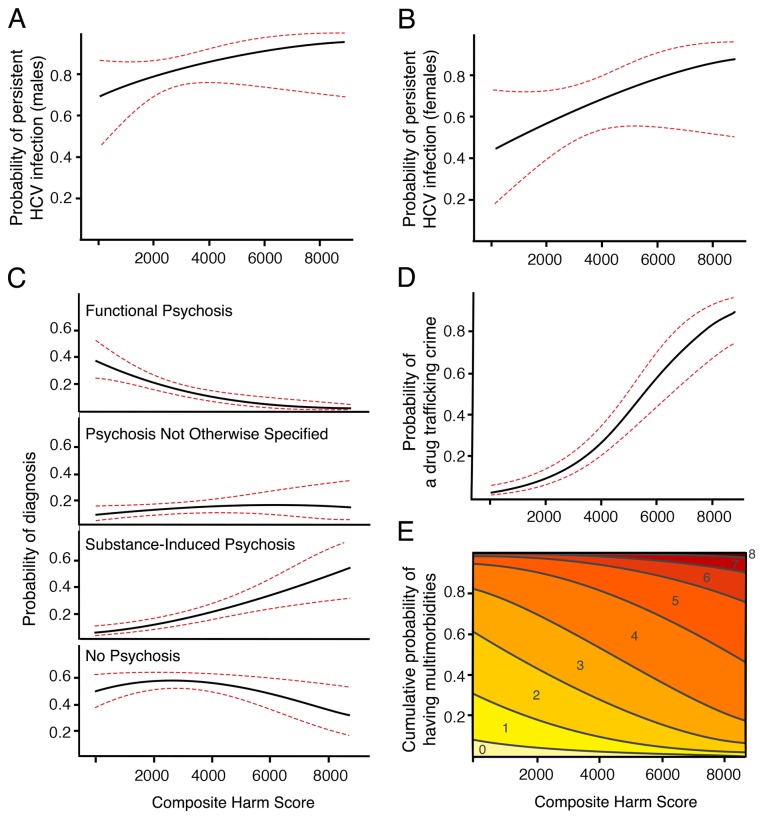
Figure 2. The effect of CHS on the probability of persistent HCV infection, specific psychosis diagnosis, drug trafficking criminal activity, and multimorbidity score.
Estimated effect curve (black line) and 95% CI (red, dashed line) are presented for each plot. Panels A and B show the effect display of the influence of CHS on the probability of of persistent HCV infection in males (A) and females (B) adjusting for age. The vertical axis displays the probability of having an active HCV infection at the first serology screen. Panel C shows the effect display of the influence of CHS on psychosis diagnoses, controlling for age and sex. The vertical axis of each display is the probability of substance-induced psychosis, functional psychosis, PNOS, or no psychosis diagnosis, respectively. Panel D shows the effect display of the influence of CHS on the probability of engaging in drug trafficking, adjusting for age and sex. The vertical axis displays the probability of a drug trafficking crime being reported at the baseline assessment. Panel E shows the effect display of the association between CHS and the cumulative probability of having one or more of twelve multimorbid illnesses. Colored bands represent multimorbidity score, ranging from 0-8 in this display.

