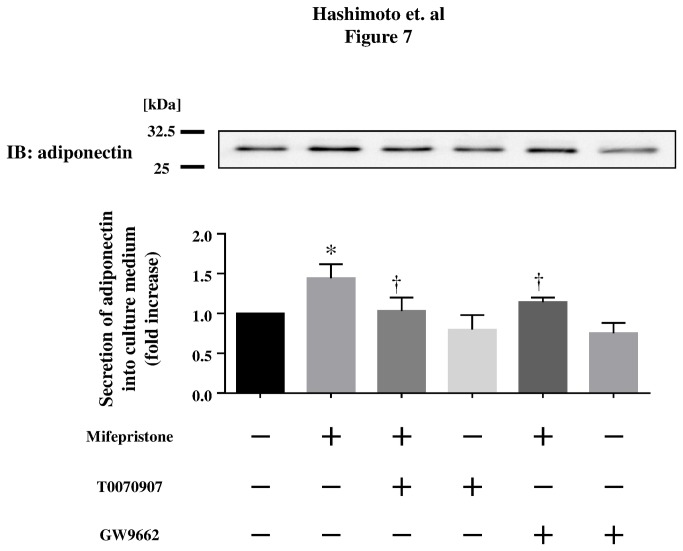
Figure 7. Effects of mifepristone on adiponectin secretion levels in differentiated 3T3-L1 adipocytes.
Shown are the results of immunoblot analyses in differentiated 3T3-L1 adipocytes. Cells were treated with mifepristone or vehicle at the indicated concentrations for 3 days. 3T3-L1 adipocytes were serum starved and treated with 1-µM mifepristone and/or 10-µM PPARγ inhibitors (T0070907 or GW9662). Equal volumes of culture medium were collected and analyzed by Western blot analysis using an antibody specific to adiponectin. Lower half panel shows the results of densitometric analysis, plotting the fold increase in the degree of adiponectin secretion levels after mifepristone addition. Bands corresponding to adiponectin were quantified by densitometry and were normalized to the signals obtained in the absence of mifepristone. Pooled data are summarized in the graphs in each assay set. * p < 0.05 versus for mifepristone compared with vehicle; † p < 0.05 versus for mifepristone treated cells.

