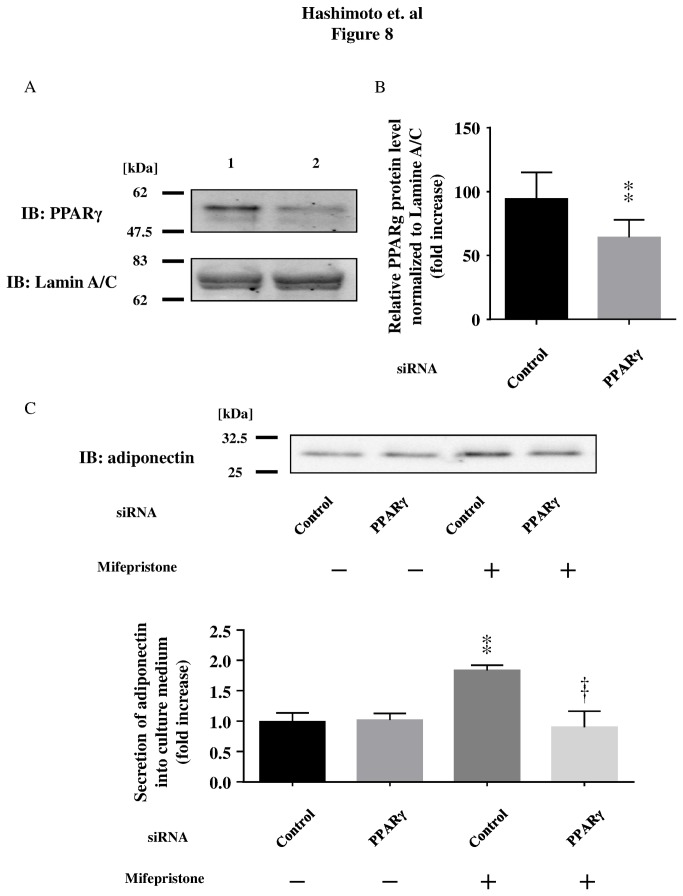
Figure 8. Effects of siRNA targeted to PPARγ in differentiated 3T3-L1 cells.
Amounts of PPARγ and Lamine A/C protein in differentiated 3T3-L1 cells after transfection of control siRNA (lane 1) or PPARγ siRNA (lane 2). Lamin A/C is a positive nuclear marker. Data are representative of five experiments (Panel A). Quantification of the PPARγ protein is shown in Panel B using a scanning densitometer. Panel C shows mifepristone-stimulated adiponectin release in differentiated 3T3-L1 adipocytes transfected with either control siRNA or PPARγ siRNA. Pooled data are summarized in the graphs in each assay set. ** p < 0.01 versus for mifepristone compared with vehicle; †† p < 0.01 versus for mifepristone treated cells.

