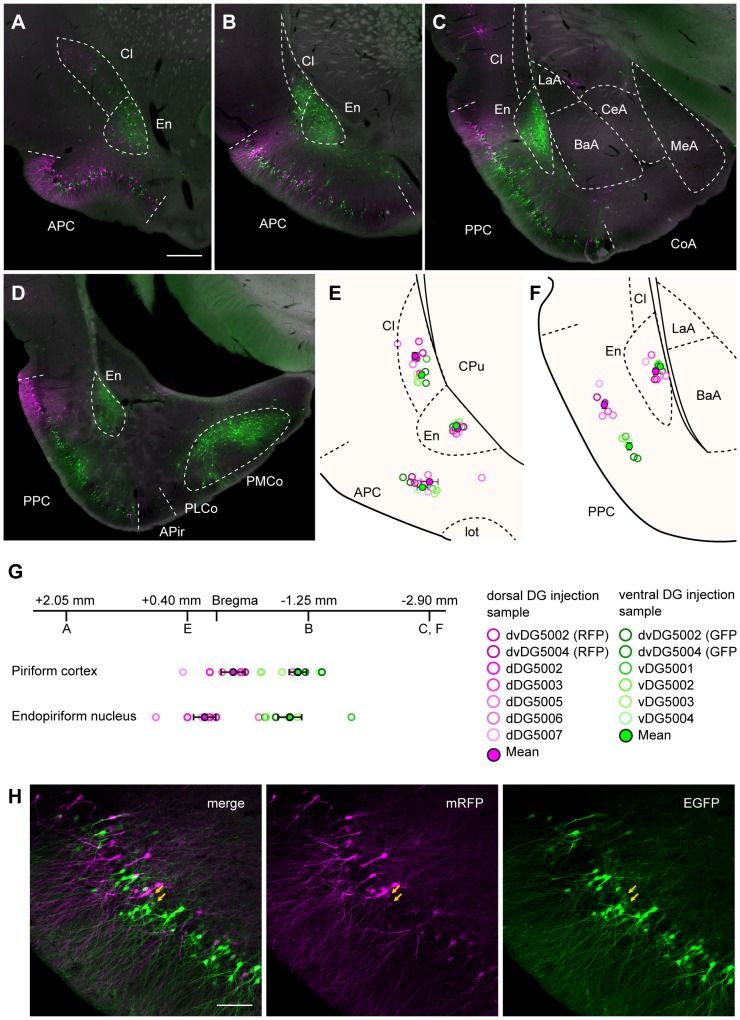
Figure 8. Distribution of retrogradely labeled neurons in the piriform and amygdaloid areas after dual-virus infection.
A–D: Labeled neurons in coronal sections through the ventral portion of the hemisphere arranged from rostral to caudal (A, B, C, and D respectively show the labeling at AP +2.05, AP −1.25, AP −2.90 and AP −4.00). Labeled neurons were seen in the anterior piriform cortex (APC), the posterior piriform cortex (PPC), the claustrum (Cl), the endopiriform nucleus (En) and the posteromedial cortical nucleus of the amygdala (PMCo). RFP-labeled cells are shown in magenta, and GFP-labeled cells are shown in green. E–F: The center of mass of labeled neurons in a coronal section at AP +0.40 (E), and at AP −2.90 (F). The open circles indicate the centers of mass for individual samples. The filled circles and the error bar indicates the mean ± SEM across samples (N = 7 for dorsal-DG injection, and N = 6 for ventral-DG injection). The results of the dorsal-DG injection are shown in magenta while the results of the ventral-DG injection are shown in green. G: The center of mass of labeled neurons in the piriform cortex and endopiriform cortex along the rostrocaudal axis. The center of mass was obtained by averaging the positions of labeled neurons in four coronal sections from different position along the rostrocaudal axis (AP +2.05, AP +0.40, AP −1.25, AP −2.90). H: Fluorescence micrographs showing the labeled neurons in the anterior piriform cortex. Arrows indicate double-labeled neurons. lot, lateral olfactory tract. Remainder of abbreviations the same as in Figure 2, 3 and 5. Scale bar = 500 µm in A (also applies to B–D) and 100 µm in H.

