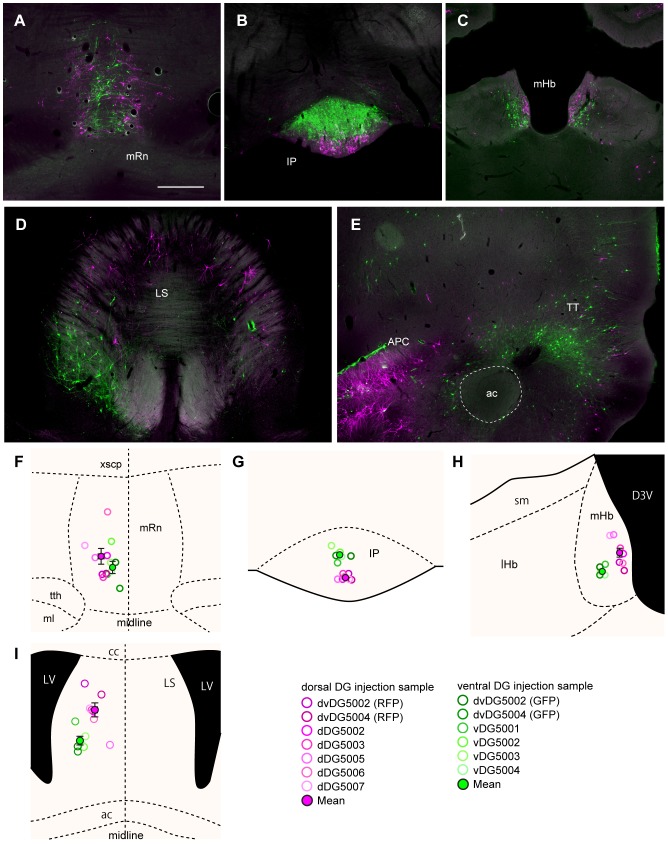
Figure 10. Distribution of retrogradely labeled neurons in second-order projection areas after dual-virus infection.
A–E: Fluorescence micrograph of labeling in the median raphe nucleus (A), the interpeduncular nucleus (B), the medial habenula (C), the lateral septum (D), and the tenia tecta (E). RFP-labeled cells are shown in magenta, and GFP-labeled cells are shown in green. F–I: The center of mass of labeled neurons in the median raphe nucleus (F), the interpeduncular nucleus (G), the medial habenula (H), the lateral septum (I). The magenta and green open circles indicate the centers of mass from individual samples with virus injection into the dorsal- and ventral-DG respectively. The filled circles and the error bar indicates the mean ± SEM across samples (N = 7 for dorsal-DG injection, and N = 6 for ventral-DG injection). ac, anterior commissure; cc, corpus callosum; D3V, dorsal 3rd ventricle; lHb, lateral habenular nucleus; LV, lateral ventricle; ml, medial lemniscus; sm, stria medullaris thalami; tth, trigeminothalamic tract; xscp, decussation of the superior cerebellar peduncle. Remainder of abbreviations the same as in Figure 2. Scale bar = 500 µm in A (also applies to B–E).

