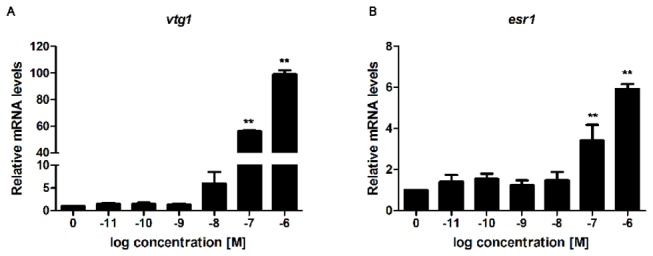
Figure 1. Dose-response curves of vtg1 and esr1 expression in zebrafish embryos.

Zebrafish embryos were treated with increasing doses of E2 continuously for 4 days and the mRNA expression levels were determined by RT-qPCR. (A) Relative vtg1 mRNA expression. (B) Relative esr1 mRNA expression. Asterisk denotes significant differences (**P<0.01; unpaired Student’s t-test compared to the controls; n=2 biological replicates; 3 technical replicates within each biological replicate). Abbreviations vtg1: vitellogenin 1 and esr1: estrogen receptor 1.
