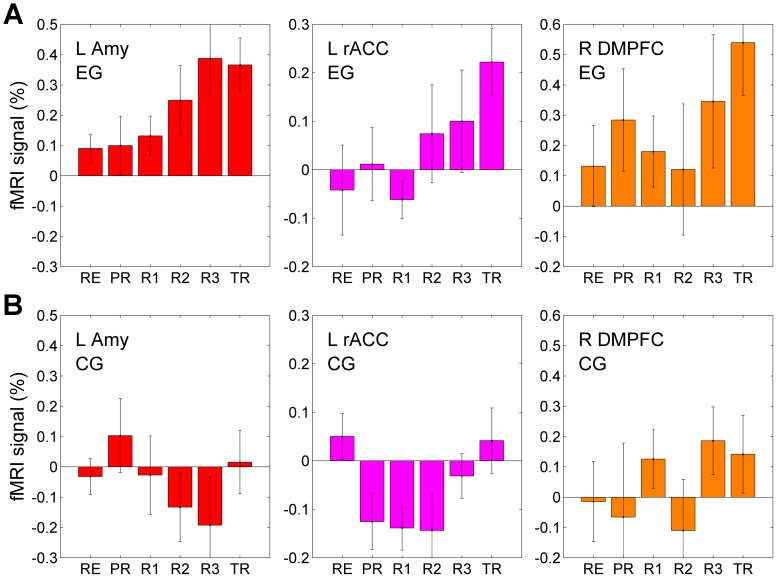
Figure 2. Learned enhancement of control over BOLD activity and emotion induction.
(A) Mean BOLD signal activity of the left amygdala during the rtfMRI neurofeedback (rtfMRI-nf) training for the experimental group (EG). The EG subjects received rtfMRI-nf based on the BOLD activity in the left amygdala ROI. Each bar represents a group average (mean±sem) of percent BOLD signal changes for the Happy Memories condition vs Rest condition for each of the six experimental runs: Rest (RE), Practice (PR), Run 1 (R1), Run 2 (R2), Run 3 (R3), and Transfer (TR). The enhancement in the left amygdala activity (red) was accompanied by increased activities of the left rACC (magenta), the right DMPFC (orange), as well as the other ROIs depicted in Fig. 1. (B) Lack of learned control over BOLD activity of the left amygdala and other regions for the control (sham) group (CG). The CG subjects received sham rtfMRI-nf based on BOLD activity in the left horizontal segment of the intraparietal sulcus (HIPS), presumably not involved in emotion regulation.

