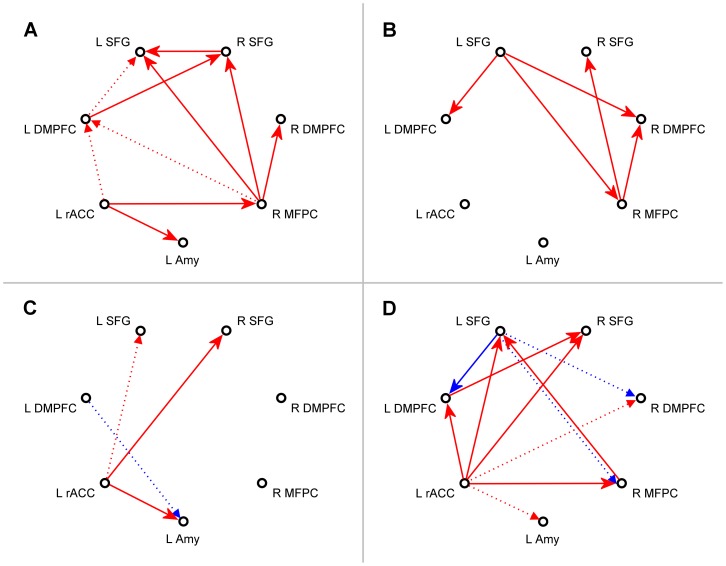
Figure 3. Interactions within the network suggested by the multivariate VAR analysis.
Results of the multivariate first-order vector autoregression (VAR) analysis for the network of seven ROIs depicted in Fig. 1. The four subplots show meta-analytic group statistics for path coefficients for the following groups and contrasts. (A) Experimental group (EG), neurofeedback Run 3. (B) Control group (CG), Run 3. (C) Difference between Run 3 and Rest for EG. (D) Difference between Run 3 for EG and Run 3 for CG. Red arrows denote augmentation effects (path coefficient α>0), and blue arrows – inhibition effects (path coefficient α<0). In (A) and (B), solid arrows correspond to effects with FDR q<0.05, and dotted arrows – to effects with 0.05≤q<0.1. In (C) and (D), solid arrows correspond to results with uncorrected P<0.05, and dotted arrows – to results with 0.05≤P<0.1.

