
Figure 2. Change in thirst (cm on VAS) during the osmotic challenge in responders and non-responders.
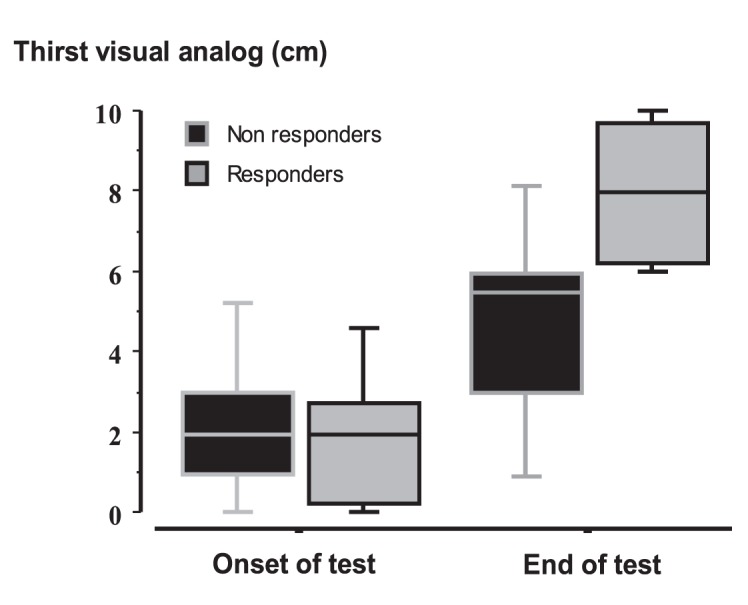
Thirst was comparable between the two groups at baseline but was significantly greater in responders at end of test Values are expressed as median with interquartile range.