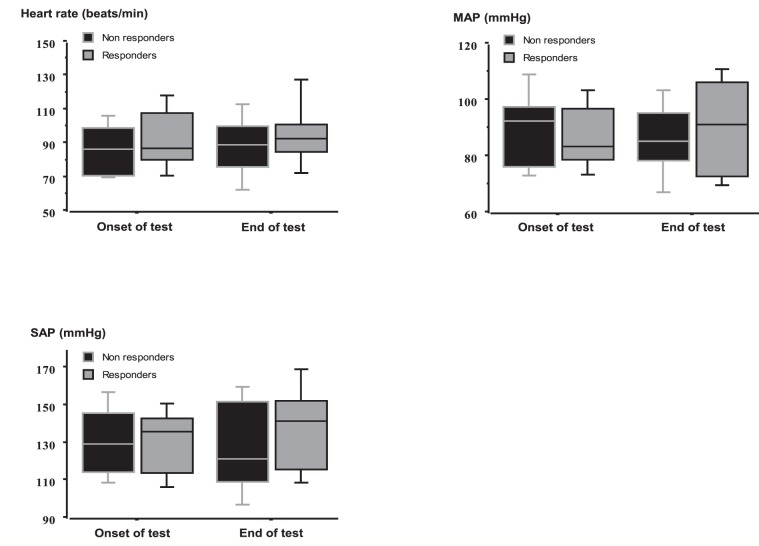
Figure 3. Variations of heart rate (beats/min), mean arterial pressure (MAP) (mmHg) and systolic arterial pressure (SAP) (mmHg) during the osmotic challenge in responders and non-responders.
During osmotic challenge, changes in heart rate, SAP, MAP, and plasma levels of BNP did not differ between the two groups Values are expressed as median with interquartile range.

