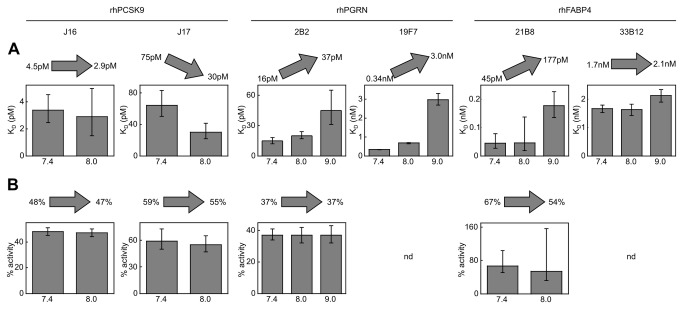
Figure 4. Influence of pH on the apparent affinity (top) and apparent activity (bottom) of different mAbs towards their purified recombinant antigens.
The KD values and mAb activities for each interaction were obtained from a single curve KinExA analysis performed at different pH values that spanned the pH range encountered during serum experiments. The bars represent the best fit values and the error bars represent the 95% confidence interval. The arrows indicate the trend observed with increasing pH and the range of best fit values for KD and activity. Only sweet spot experiments enabled a determination of both the KD and the mAb activity (no mAb activity is reported for 19F7 and 33B12 because those curves were mostly KD-controlled). The antigen concentrations used were 128 pM rhPCSK9, 42 pM rhPGRN, 21 pM rhPGRN, 100 pM rhFABP4, and 1nM rhFABP4 (from left to right).

