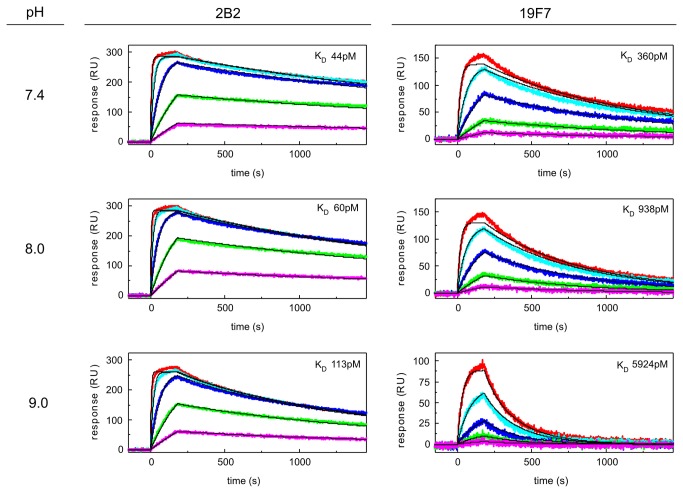
Figure 6. Kinetic analysis of anti-PGRN mAbs 2B2 (left) and 19F7 (right) in TBST buffers at different pH values.
The data were collected on a ProteOn XPR36 biosensor by injecting a dilution series of rhPGRN (0.8, 2.4, 7.1, 21.3, and 64 nM) over amine-coupled mAbs. Double-referenced sensorgrams (colored lines) obtained from two ligand channels per mAb were fit globally to a 1:1 binding model with mass transport limitation (fit shown in black); the results from one channel per mAb is shown along with the global best fit KD.

