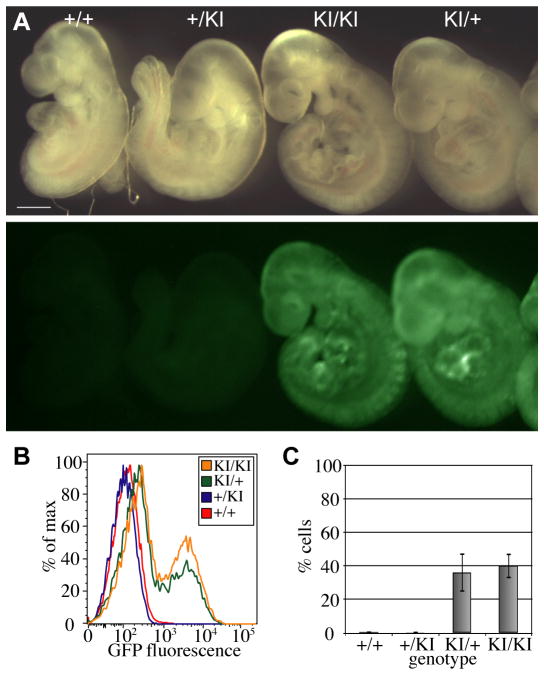
Fig. 3. Regulation of GFP expression from Tel7KI in post-implantation embryos.
(A) E9.5 wild-type (+/+), paternal transmission (+/KI), maternal transmission (KI/+), and homozygous (KI/KI) embryos show imprinted expression of GFP viewed in bright field (above) and under GFP fluorescence (below). Scale bar: 1 mm. (B) Flow cytometry data of single disaggregated E9.5 mouse embryos. GFP expression profiles are from single +/+ (red), +/KI (blue), KI/+ (green), and KI/KI (orange) embryos. (C) Summary of flow cytometry analysis over multiple litters showing the percentage of cells expressing GFP in E9.5 embryos. Bars indicate mean and standard deviation of results obtained from multiple individual embryos: +/+ n=3, +/KI n=9, KI/+ n=14, and KI/KI, n=4.

