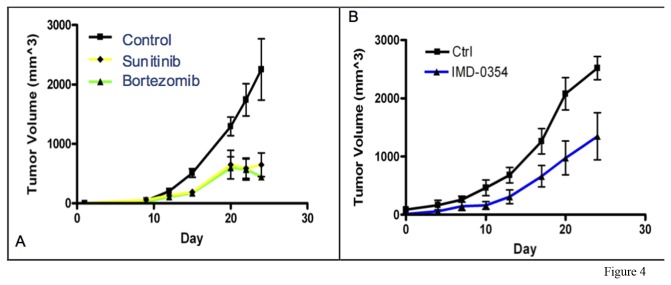
Figure 4. A) Chordoma xenograft tumor growth curves in control mice and mice treated with Sunitinib (p = 0.026) or Bortezomib (p = 0.015) measuring from the start of treatment.
B) Chordoma xenograft tumor growth curves of control mice and mice treated with IKK-inhibitor IMD-0354 (p = 0.03) measuring from start of treatment. Each data point is the mean tumor volume, and error bars show the standard error, of the entire cohort on the indicated day. Data were analyzed for significance using a 2-way ANOVA, with p < 0.05 considered significant.

